 Categories by Sales & Traffic
In this section:
Categories by Sales
This metric visualizes the top-selling categories* based on the total revenue generated from products within a specific category for all orders during a given period. You can set a specific period and compare it to the previous period/year.
*The data is visualized according to the default order statuses in "Settings" - Paid, Fulfilled, Pending, Payment Authorized, Shipped.
The list includes the top 5 best-selling categories that have generated the highest revenue in sales as the sum of products within the category. It provides information for each category in percentage ratio based on the desktop and mobile version by customers who placed an order, as well as data on the total revenue from the category and the total quantity of products sold within the category for the period. If you hover your mouse cursor over a particular item, you will also see the total number of orders made through it (desktop or mobile).

You can click directly on the category to obtain additional information about it. You will find information such as:
- Total number of customer views on the category
- Total number of orders involving products from the category
- Total quantity of products sold
- Conversion rate - the percentage of visits that led to an order from the total number of visits
- Total revenue from the category

From the additional options, you can select the data comparison option and the time period for visualizing the data - hourly, daily, monthly, quarterly, or yearly. You can export the data you see using the button in your screen's upper right corner.
Important! Both main categories and their subcategories are visualized. In this case, if the best-selling products belong to a subcategory, you will see the subcategory as the top-selling one, not an overall summary for the main category.
View Details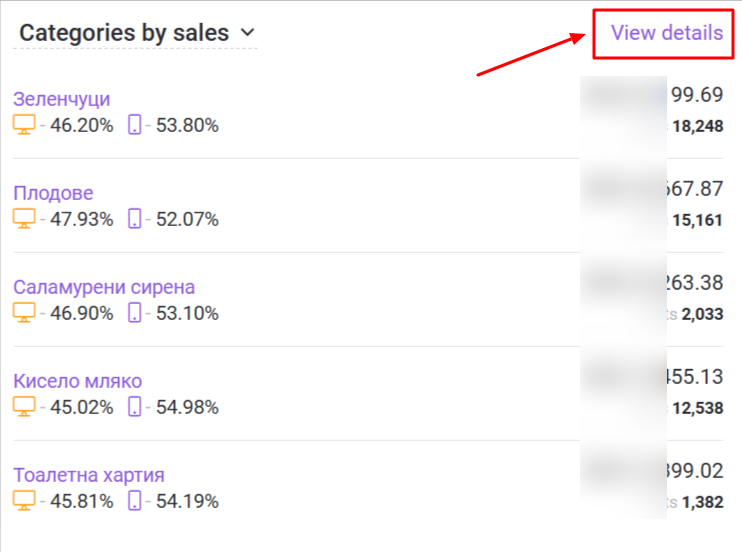
You can set a specific period for visualizing the most visited categories or subcategories, depending on the ones included in the statistics - top-selling. You can choose from three options - no comparison, comparison with the previous period, or comparison with the previous year. 
You will receive information about the most visited categories in ascending order with their names, category/subcategory views, the total number of orders involving products from the category/subcategory, the total quantity of products sold, the conversion rate for the category - the percentage of visits that led to an order from the total number of visits, and the total revenue from the category/subcategory. 
When selecting a specific category, you will receive detailed information with the same indicators but for the chosen time period - hourly, daily, monthly, quarterly, yearly, and the option to select a comparison.
The displayed records in the "View Details" section are limited to 1000 items. If you have more records, you can view them by exporting them using the respective button. Exported data is limited to 150,000 records.
Categories by Traffic
This metric visualizes data for the most visited categories in your online store based on visits for a given period. You can set a specific period and compare it with the previous period/year.
Comparison can be made with a period no later than January 17, 2023, as the collected data is from the specified date.
The list includes the top 5 most visited categories in your online store, with information for each category presented as a percentage breakdown of desktop and mobile device usage. If you hover your mouse cursor over a specific item, you will see the total number of visits made through it (desktop or mobile). 
You can click directly on a category to obtain additional information about it. You will find information such as:
- Total number of views by customers in the category
- Total number of orders involving products from the category
- Total quantity of products sold in the category
- Conversion rate: the percentage of visits that led to an order from the total number of visits
- Total revenue from products in the category

Additional options allow you to compare the data and choose the time period for data visualization: hourly, daily, monthly, quarterly, or yearly. You can also export the displayed data using the button in the screen's upper right corner.
Important! Both main categories and their subcategories are visualized. In this case, if the best-selling products are from a subcategory, you will see the subcategory as the top-selling item rather than an overall summary of the main category.
View Details

You can specify a specific period for visualizing the most visited categories or subcategories and choose from three options: no comparison, comparison with the previous period, or comparison with the previous year. 
You will receive information about the most visited categories/subcategories in ascending order with their names, the number of category/subcategory views, the total number of orders involving products assigned to the category/subcategory, the total quantity of products sold, the conversion rate for the category/subcategory (the percentage of visits that led to an order from the total number of visits), and the total revenue from the category/subcategory. 
When selecting a specific category, you will receive detailed information with the same indicators but for the selected time period: hourly, daily, monthly, quarterly, or yearly. You also have the option to make comparisons.
The displayed records in the "View details" section are limited to 1000. If you have more records, you can view them by exporting them using the respective button. Exported data is limited to 150,000 records.